Reading DHI Cow Somatic Cell Reports
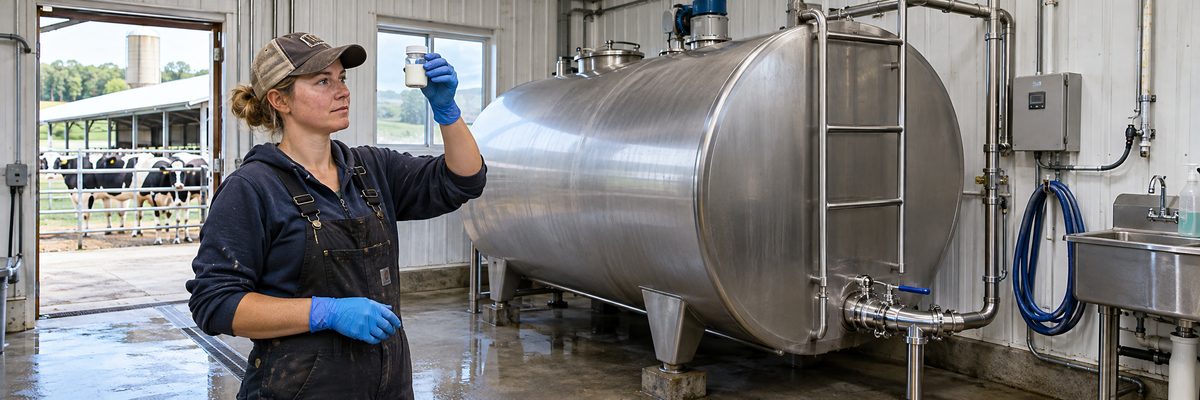
Every month or so, a DHI technician shows up, samples every cow, and a few days later you get a stack of paper or a screen full of numbers. Most of the herd's udder health story is sitting in there, and most of us look at the milk weights and close the file. The somatic cell columns are where the high-count cows give themselves away.
The quick approach: find the SCC and linear score columns, sort the cows from highest to lowest, and look for cows that are high on this test and were high on the last one too. Those chronic cows are your short list. Then check fresh cows, who often run high on the first test and settle, and cows that jumped from low to high, who are probably new infections.
The report will not tell you which quarter, which bug or what to do about it. It tells you where to look. The rest is cow work.
What is on the report
DHI reports vary by provider and software, so your layout may not match anyone else's. The terms below are common, but check your own report and ask your DHI supervisor if something is unclear.
- SCC. The cow's somatic cell count from the test-day sample, usually shown in thousands of cells per milliliter. A value of 350 means 350,000.
- Linear score (LS). A transformation of SCC onto a smaller scale. Each one-point rise roughly doubles the count. A linear score of 4 is about 200,000 cells per milliliter. This is general dairy science and from memory, so confirm the conversion table with your provider.
- Previous test values. Many reports show the last test or two, which lets you spot a pattern without flipping pages.
- Days in milk (DIM) and lactation number. Context for the count. A fresh cow, an old cow and a cow at the end of lactation are not directly comparable.
- Milk yield. A cow with a high count and falling milk is losing money for you.
- Mastitis or milk loss estimates. Some reports calculate estimated production loss linked to SCC. Treat it as an estimate.
- Herd summaries. Percent of cows over a threshold, average linear score, estimated new infection and chronic infection rates, and so on.
The labels change from one provider to the next, and some herd management software dresses up the data differently. Ask for a list of definitions the first time you see a new report.
How to find the problem cows
- Sort by SCC or linear score, high to low. Most software can do this. On paper, use a highlighter.
- Mark cows over about 200,000 (linear score 4). That is a common line for a cow likely to have an infection, though some herds use a stricter or looser cutoff depending on their goals.
- Look at the previous test. If a cow was also over the line last time, she is chronic. If she jumped from a low count to a high one, she is a new infection candidate.
- Check DIM. Fresh cows in the first couple of weeks of lactation often have elevated counts that settle. A fresh cow that stays high on the second test is a concern.
- Check lactation. Heifers with high counts at first test can point to problems before calving, in the dry period or in the pen. See dry cow housing and close-up pen management for what to look at.
- Add milk yield. A cow that has high SCC and is producing poorly is costing you more than one that is high and producing well.
- Make the list. A handful of names is usually enough to act on, and it can be done in ten minutes.
Patterns worth recognizing
| Pattern | What it often suggests | Next step |
|---|---|---|
| High at two or more tests in a row | Chronic infection | Cow-side test, culture and a talk with your vet about treat, dry off a quarter, separate or cull |
| Low last test, high now | New infection | Check the cow for clinical signs, quarter test and review recent changes in routine or environment |
| High at first test after calving, falls on the next | Often settling after calving | Watch her, confirm with the next test |
| Many heifers high at first test | Problem before or at calving | Look at close-up pen, heifer housing, fly control and prepartum management |
| Rising counts late in lactation | Normal drift plus chronic cows | Review dry-off decisions and culling |
| Many cows moderately high | Herd-wide issue | Check routine, machine and bedding |
The table gives general patterns, not diagnoses. Your vet or milk quality adviser should interpret them for your herd.
Turning the list into action
Once you have a short list, you need a cheap way to find out which quarters are involved and what bug is there. A cow-side screen such as the California Mastitis Test can narrow it to a quarter. Then a milk sample for culture, covered in on-farm milk culturing for mastitis decisions, tells you what you are dealing with.
From there, the decisions are yours and your vet's: treat, dry off the quarter, segregate and milk last, or cull. Any treatment has withdrawal times that must be followed, and milk from treated cows stays out of the tank. The bigger picture is in how to lower bulk tank somatic cell count.
Common mistakes when reading the report
- Looking only at the herd average. A good-looking average can hide a few bad cows. A bad average can be caused by two or three outliers.
- Ignoring one-time spikes. A single test is a snapshot. Confirm with another test or cow-side check before making a big decision.
- Not comparing to the tank. Add up the high cows and check whether they explain the bulk tank number. If they do not, look at timing and which cows were in the tank.
- Treating every cow over the line the same. A fresh heifer with a single high test and an old cow with a year of high counts are different problems.
- Letting the report pile up. The data is only useful if someone opens it on test day, not three weeks later.
- Forgetting it is a sample. Cows are tested once a month, so a cow could have changed since the sample was taken.
The test-day report has its own quirks by region and provider. Large herds in the West may get frequent testing with on-farm software, while smaller Northeast and Upper Midwest herds often rely on a monthly visit and a printed report. Some farms use robotic or in-line sensors that give daily numbers, which are helpful but should be confirmed against lab values. For more on how DHI works and how to find a provider, see DHIA, the national dairy herd information organization, and for udder health resources the National Mastitis Council fact sheets.
Quick answers
What SCC on a DHI report means a cow is infected?
A common rule of thumb is that cows above about 200,000 cells per milliliter, or a linear score of 4 or higher, are likely to have an infection in at least one quarter. It is a screening line, not proof, so confirm with a test or culture and talk to your vet.
How often should I look at my DHI SCC data?
Every test day, ideally within a few days of getting the report. Sorting for high and rising cows takes a few minutes, and catching a new infection early is cheaper than finding it in the tank.
Why does my tank SCC not match my DHI average?
The tank is a milk-weighted blend of the cows that were milked into it, while DHI reports average the cows tested on a given day. Cows that were treated, dried off or held out of the tank can change the picture, and the timing of the samples is different too.